
Week Ahead: NIFTY Violates Key Support Levels; Drags Resistance Lower
The over-deviated markets continued to extend their losses for the fourth week in a row. The Nifty remained largely under sustained selling pressure over the past five days, barring a few feeble attempts to stage a technical rebound. The markets extended their downsides while giving up key supports on the daily charts. The trading range widened again; the Nifty oscillated in a wider 904-point range before ending with a decent cut. The volatility also spiked; the India Vix surged by another 12.23% to 14.63 on a weekly basis. Following a largely bearish setup throughout the week, the headline index closed with a net weekly loss of 673.25 points (-2.71%).

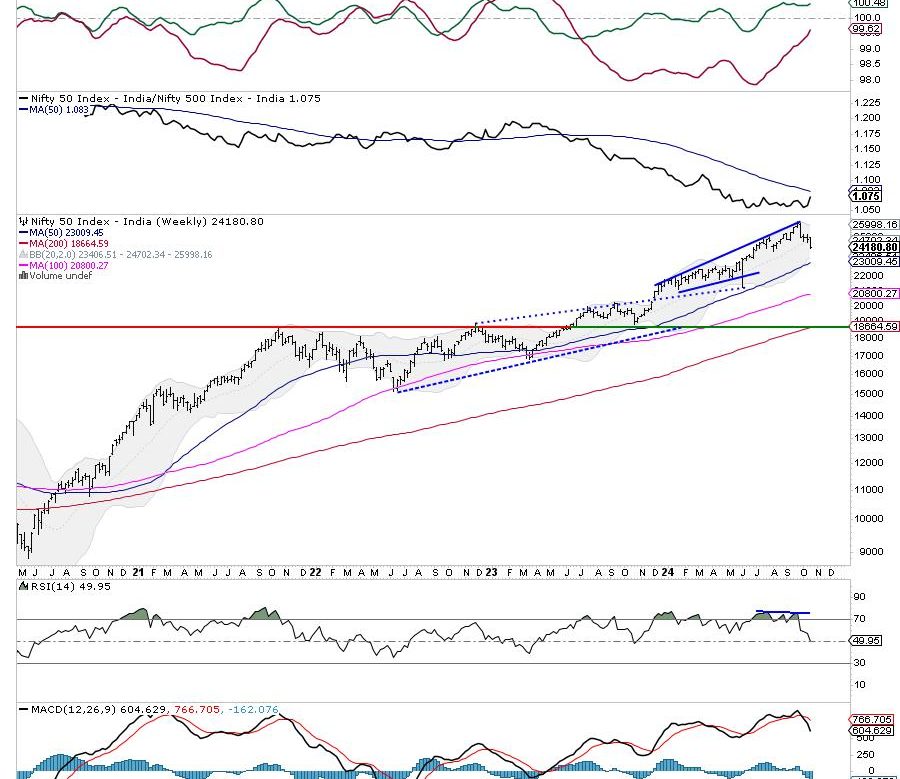
The coming week is a truncated one; Friday is not a trading holiday but it will just have a very short, one-hour ceremonial Mahurut Session. Overall, the volumes are expected to remain low given the festive season. The Nifty has violated the 100-DMA on the daily chart which stands at 24591. It has already given up the 20-week MA which is placed at 24702. Given these adverse technical developments, the Nifty has dragged its resistance levels much lower to 24500-24700 zones. Any technical rebounds will find resistance here. In other words, so long as the markets trade below this zone, all rebounds are more likely to get sold into.
The coming week may see a tepid start; the levels of 24450 and 24650 are likely to act as resistance levels. The supports are expected to come in at 23950 and 23700. The trading range is likely to stay wider than usual.
The weekly RSI stands at 49.95. It has formed a fresh 14-period low; however, it stays neutral and does not show any divergence against the price. The weekly MACD is bearish and trades below the signal line.
The pattern analysis shows the high point of 26277, which is confirmed as an intermediate top for the markets. The decline has also seen Nifty breaching pattern support at 24750 levels. This pattern support is in the form of a rising trend line which begins at 22124 and extends itself. The 20-week MA and the 100-day MA also stand violated meaningfully on a closing basis. The resistance levels have been dragged lower; all technical rebounds will find resistance in the 24500-24700 zone from a short to medium-term perspective.
The markets have entered a technical setup that is likely to create a challenging environment. The risk-off setup is evident; it would be imperative to stay invested in stocks that have strong relative strength against the broader markets. Such investments shall offer greater resilience if the weakness in the markets persists for a longer time. While staying highly selective, a cautious approach is advised for the coming week.
Sector Analysis for the coming week
In our look at Relative Rotation Graphs®, we compared various sectors against CNX500 (NIFTY 500 Index), which represents over 95% of the free float market cap of all the stocks listed.

Relative Rotation Graphs (RRG) continue to show a few pockets of resilience building up in the markets. The Nifty Services Sector, Pharma, Consumption, and IT indices are inside the leading quadrant. They may continue relatively outperforming the broader markets.
The Nifty FMCG index has rolled inside the weakening quadrant. Besides this, the Midcap 100 index is also indie the weakening quadrant.
The Nifty Auto and Media Indices have rolled inside the lagging quadrant. This group is likely to relatively underperform along with the Energy, PSE, and Energy. The Infrastructure, Commodities, PSU Bank, and Realty Indices are also inside the weakening quadrant. However, they are seen improving their relative momentum against the broader markets.
The Nifty Bank, Metal, and Financial Services indices are inside the improving quadrant; they are likely to improve their relative performance against the broader markets.
Important Note: RRG™ charts show the relative strength and momentum of a group of stocks. In the above Chart, they show relative performance against NIFTY500 Index (Broader Markets) and should not be used directly as buy or sell signals.
Milan Vaishnav, CMT, MSTA
Consulting Technical Analyst